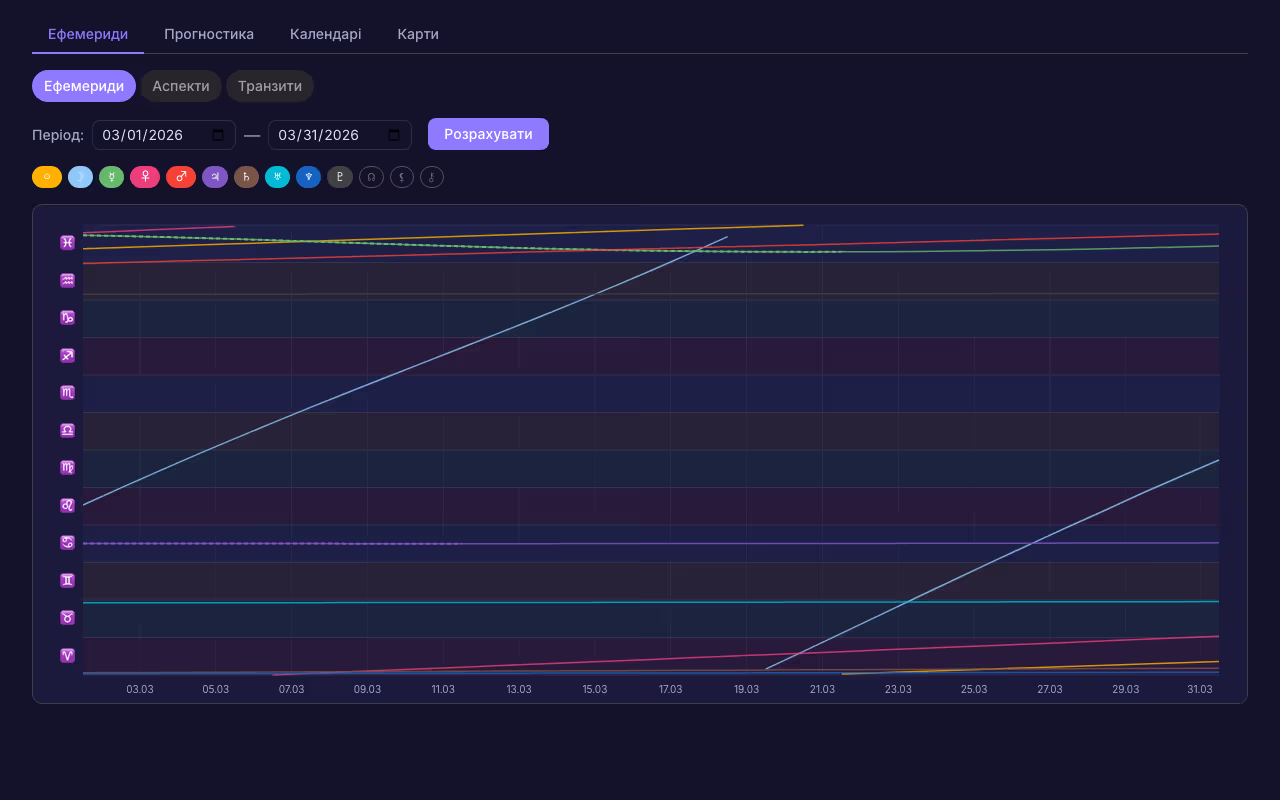
Overview
The graphical ephemeris displays planet positions as continuous curves across the zodiac: - Horizontal axis: time (days, weeks, months, or years) - Vertical axis: zodiac longitude (0°–360° or by sign) - Each planet drawn as a colored curve - Retrograde periods clearly visible as backward loops - Station points (direct/retrograde) marked - Sign boundaries shown as horizontal lines - Zoom into any time range for detail - Natal planet positions overlaid as horizontal reference lines - Useful for spotting clusters, patterns, and timing windows
Related tools
Natal Chart
Complete natal chart with planets, houses, aspects, declinations, antiscia, Arabic lots, fixed stars, and Sabian symbols.
Transits
Current planet positions overlaid on natal chart with real-time aspects, time slider, and animated playback.
Hyleg / Alkokoden / Anareta
Classical techniques for life span determination by Ptolemy — Hyleg, Alkokoden, Anareta, Auriga, Doryphory.
Eclipse Calendar
Solar and lunar eclipse finder with dates, types, magnitudes, and zodiac positions for any year range.
Djamaspa (Avestan Calendar)
Persian totem calendar — 32 animal totems for year, month, day and hour according to the Globa system.
Synastry
Chart comparison with inter-chart aspects, composite, Davison chart, and planet placement in partner's houses.