
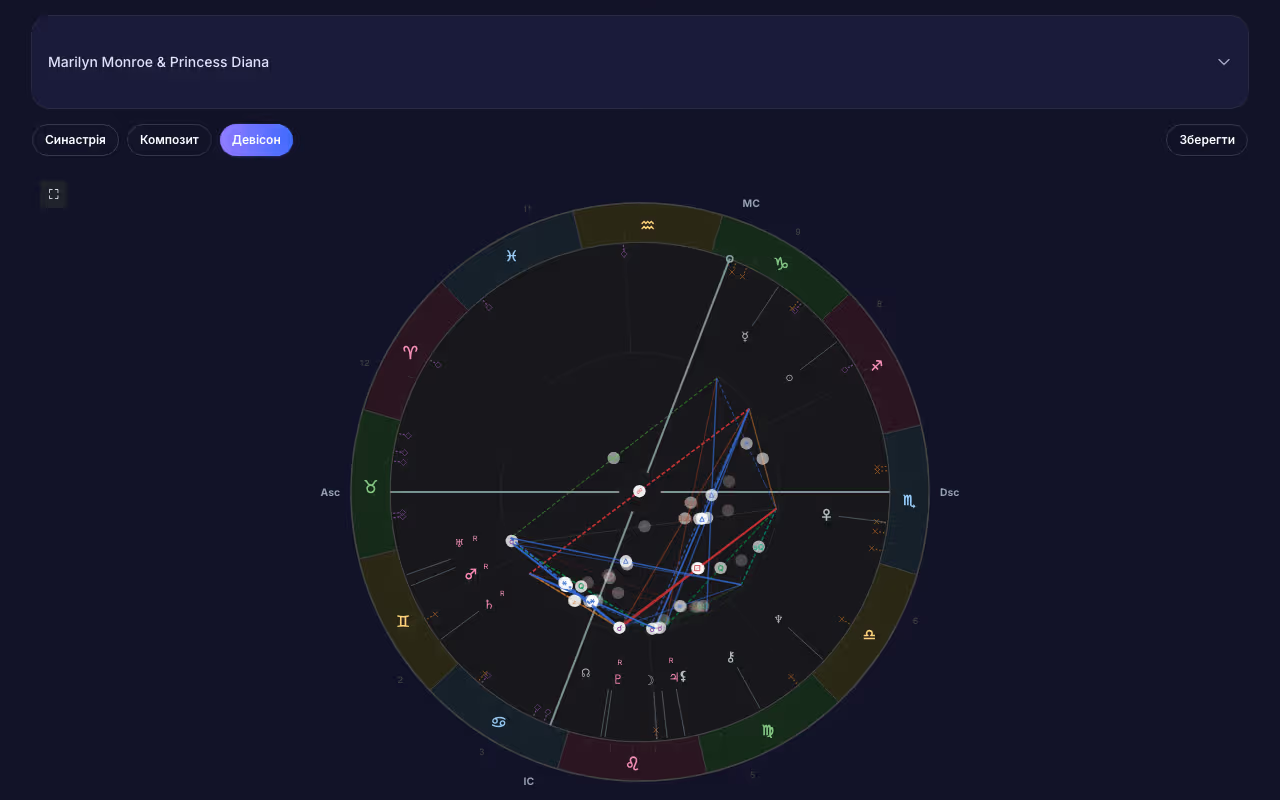
♡ Davison Chart

Midpoint chart for the average date, time, and coordinates of two births. Unlike the composite, this is a true moment in the sky, so transits and progressions can be applied to it.

Davison Chart 1

Overview

Midpoint between two birth charts - averaged time, date and place for relationship analysis.

Davison's Chart

The Davison chart is not built from the planets of two people, but from the midpoint between their birth times. The average date and time and average geographic coordinates are taken, after which the chart is calculated as a regular natal chart for that point in space and time.

The key difference from the composite is that the Davison chart is an actual moment: the planets in it are positioned where they truly were in the sky at that second. The composite, on the other hand, is assembled from mathematical averages and does not correspond to the real sky.

  • Average date, average time, average latitude and longitude
  • The chart reflects the current planetary positions.
  • Has its own transits, progressions, and solar returns like a standard chart.

How is midpoint calculated

Time is averaged in Julian days, not in calendar dates, otherwise an error occurs at the month boundaries. For two people with a difference of eight years, the average date falls at a point four years from each birth.

With coordinates, be more careful: the average longitude of two cities may fall into the ocean, and this is normal because the point doesn't need to be inhabited. The problem only arises when crossing 180 degrees, where the average must be taken along the shorter arc.

  • Time averaging is performed in Julian days
  • Midpoint of space can be located in the ocean, this is not an error
  • Transition through 180 degrees of longitude requires averaging along the shorter arc

Reading the Davison Chart

The chart describes the connection itself as a separate entity: what kind of relationships they are by nature, where they are heading, and where there is tension. The Ascendant shows how the couple appears externally, while the tenth house represents what they are to their surroundings.

Reading a Davison chart instead of synastry is not advisable. Synastry shows how two people influence each other, while the Davison chart shows the result that comes from this.

  • Chart's Ascendant: couple's outer image
  • Sun and Moon: essence and emotional climate of the connection
  • The 7th house in the Davison chart itself relates to third parties.

Davison Chart Forecast

Since this is a real moment in time, all standard techniques apply to the chart: transits, secondary progressions with a day-for-a-year ratio, and solar returns for each year.

Nearly all the most informative transits of slow planets to the Davidson chart angles and its luminaries coincide with turning points in relationships, whereas fast transits only produce mood swings.

  • Transits of Saturn and outer planets to chart angles
  • Secondary progressions operate on the standard day-for-year rhythm.
  • Solar Davis chart is built for the date of the midpoint.

Method Limitations

Davison charts require the exact birth times of both individuals: an error in even one of them shifts the midpoint and distorts the chart’s angles. With approximate times, only planetary signs can be used, not house cusps.

The method was formulated by Ronald Davison in the second half of the twentieth century and has no ancient tradition. This is not a flaw, but there are fewer verified rules for interpretation than for classical techniques.

  • Accurate birth time required for both
  • A 1-degree error shifts the midpoint for the entire chart.
  • Modern method, little accumulated tradition of interpretation
Get started

Start Working in AstroWay App

Create your first natal chart in minutes. Free, precise, and private. 7-day PRO trial included.

Get started